cmdock ships with Prometheus metrics for server health out of the box: request rates, latency, error counts, connection pool state. Someone in the beta asked whether they could also see their actual task data in Grafana. Overdue counts. Due buckets. Priority breakdown. Project trajectory.
That is a different question. Server metrics track whether the server is healthy. Task data metrics show what is actually in your task list. The server health endpoint cannot answer the second question because it does not know what your tasks contain. taskchampion-sync-server can't answer it at all — it syncs encrypted blobs and never reads task content.
But cmdock can answer it. Tasks live behind a REST API and a webhook system and the API lets you query and mutate task data directly. The webhooks fire on every change, including task created, updated, completed and deleted events. The iOS app uses the REST API and the Grafana exporter uses it. So can anything else you want to build.
The examples repo is where those integrations live. The Grafana exporter is the first.
What you get
You need two values for the .env: your server URL and an API token. The token is a user bearer token from your cmdock-server stack. Run this against your existing server (not the exporter):
# New account:
docker compose exec server cmdock-server --data-dir /app/data admin user create --username alice

# Existing account (token not saved):
docker compose exec server cmdock-server --data-dir /app/data admin token create <user_id> --label grafana-exporter
The token prints once and is not recoverable. Copy it before closing the terminal. user_id is the UUID from admin user list.
Then clone the examples repo and bring the stack up:
git clone https://github.com/cmdock/examples
cd examples/examples/reference/grafana-exporter
cp .env.example .env
# set CMDOCK_SERVER_URL and CMDOCK_API_TOKEN in .env
docker compose up -d
That gives you:
- A Python exporter polling
/api/tasksand emitting Prometheus metrics - Prometheus scraping the exporter on a 30-second interval
- Grafana pre-provisioned with the cmdock dashboard
Open Grafana at http://localhost:3000. Your task data is already there.
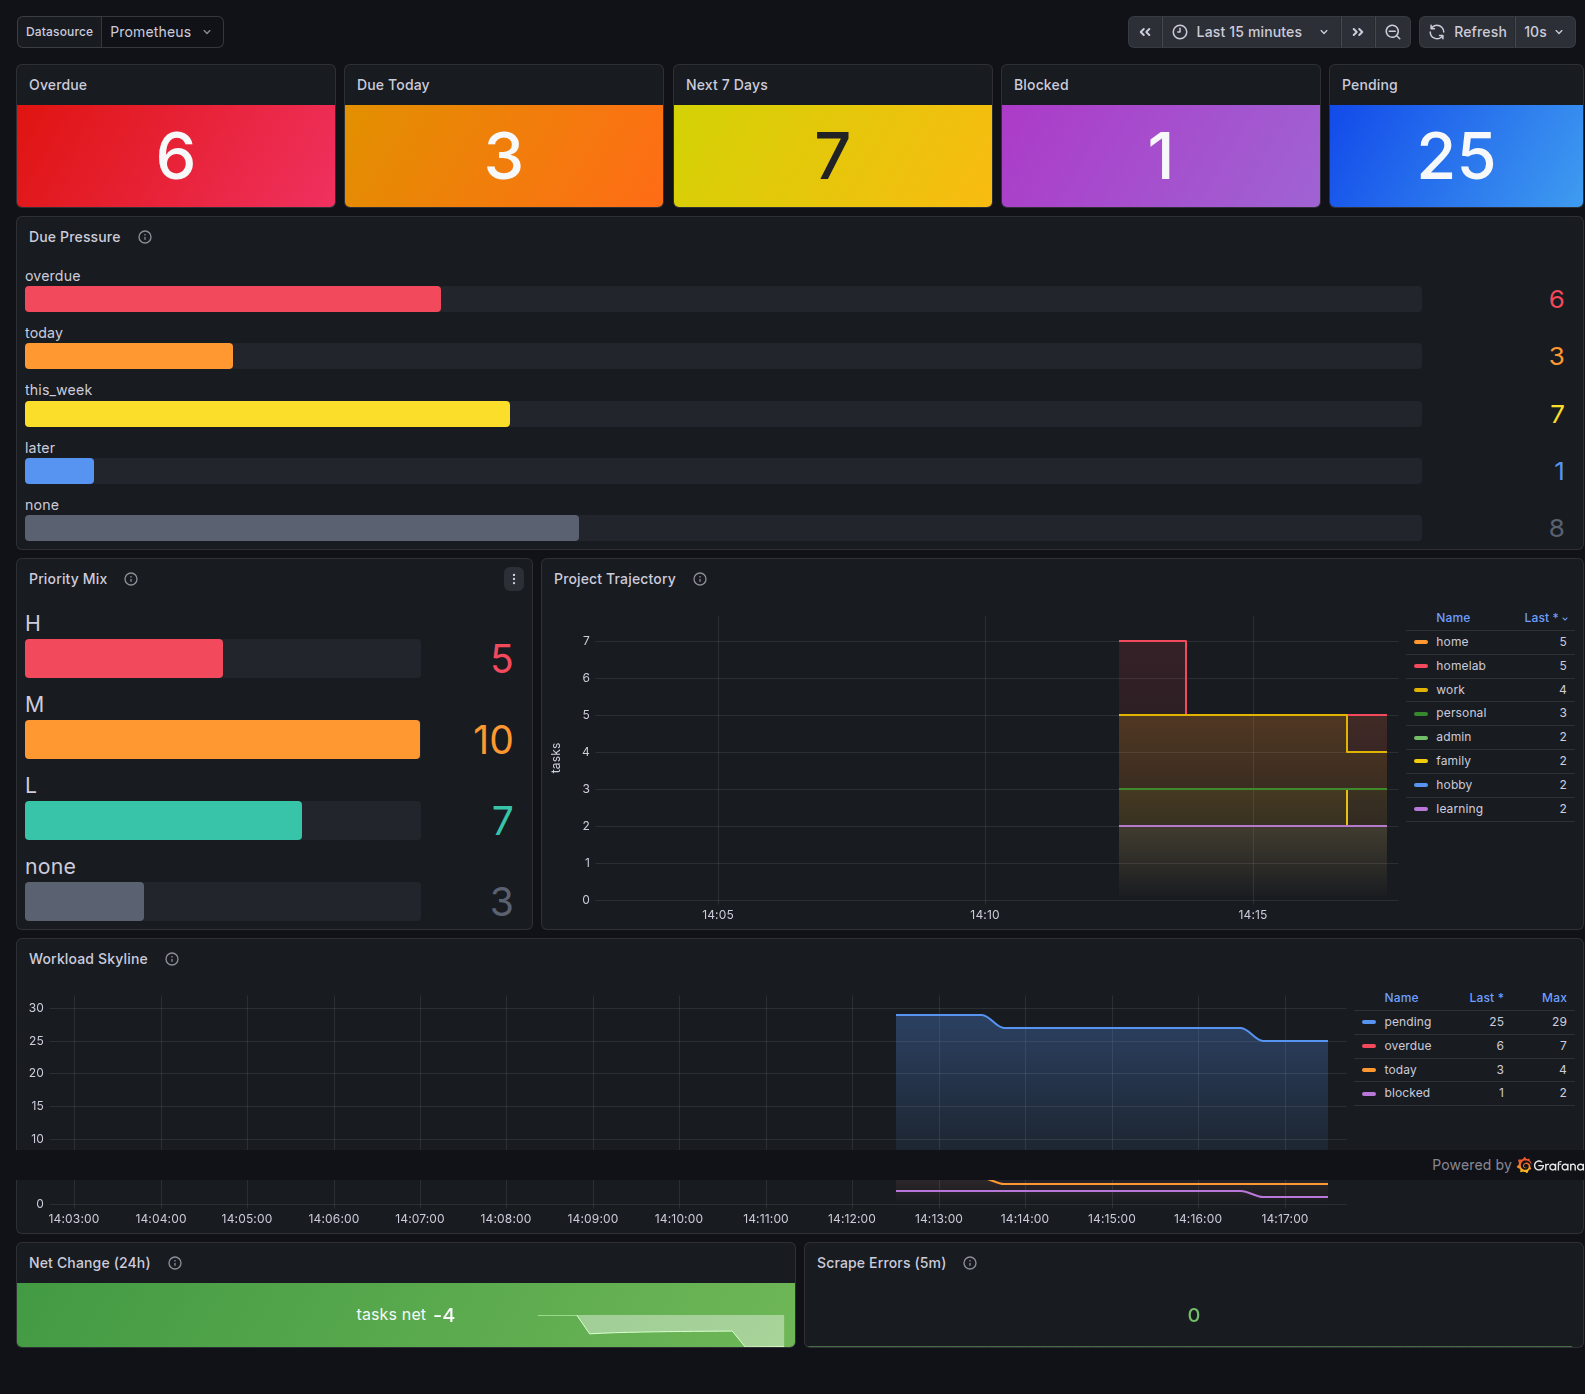
What the dashboard shows
This dashboard tracks task data, not server health metrics:
- Overdue count, with tasks past their due date updated every 30 seconds
- Due buckets grouping tasks as overdue, today, this week, later or none
- Priority distribution broken down by H, M, L and none
- Pending over time, showing how the pending task count changes across the day
The exporter ships with bounded labels by default. priority has 4 values. due_bucket has 5. Per-project and per-tag labels are opt-in. The default protects you from blowing up Prometheus storage if you have a large task set. Ask me how I know.
The model
The server exposes two integration points. The REST API queries and mutates task data. Webhooks handle event-driven reactions to changes. The REST API is what the Grafana exporter uses. Webhooks can drive things like Slack notifications when a task goes overdue, calendar sync on due-date changes and LLM summaries after project completion. Both are documented and stable.
The cmdock/examples repo is where reference integrations against those APIs live. The Grafana exporter is the first. More examples can be added without changing the server core. New integrations belong in the examples repo, not in server core.
The exporter is tested as part of server release qualification. A failing exporter blocks a server release. Self-hosters can rely on the dashboard surviving server upgrades.
Why cmdock can expose this data
taskchampion-sync-server is a deliberately small, single-purpose project. It syncs blobs the server can never read. That is the right design for a lot of deployments (lightweight, no user model to manage, genuine end-to-end encryption). The exporter is not possible there by design, and that is an honest trade-off, not a limitation.
cmdock takes the other side of that trade-off. Tasks live behind a REST API, so the server reads task content. That enables the REST API, webhooks, the Grafana exporter and the iOS app. It also means the server can read your tasks. TLS is on by default. At-rest encryption is on the roadmap.
| taskchampion-sync-server | cmdock | |
|---|---|---|
| Sync protocol | Yes | Yes |
| End-to-end encrypted | Yes (server never reads tasks) | No (server reads tasks, TLS only) |
| User model required | No (any client syncs) | Yes (accounts and access control) |
| Lightweight, single binary | Yes | No (runs as a container) |
| REST API for task data | No | Yes |
| Webhooks on task changes | No | Yes |
| Grafana dashboard for task data | No | Yes, three commands |
They are built for different purposes. taskchampion-sync-server is a sync primitive (small, secure, does one thing well). cmdock is a sync server with an application layer on top. Which one is right depends on what you need from the server.
Get it
- cmdock/examples, MIT, exporter in
examples/reference/grafana-exporter/ - cmdock/server, AGPL-3.0, self-host required
docker pull ghcr.io/cmdock/server:v0.3.2